DOT, GraphML and GEXF: Moving a Network Between the Tools That Draw It
Graphs are nodes and edges, and every tool that analyses or draws them picked a different file format. What each one carries, and why layout almost never survives.
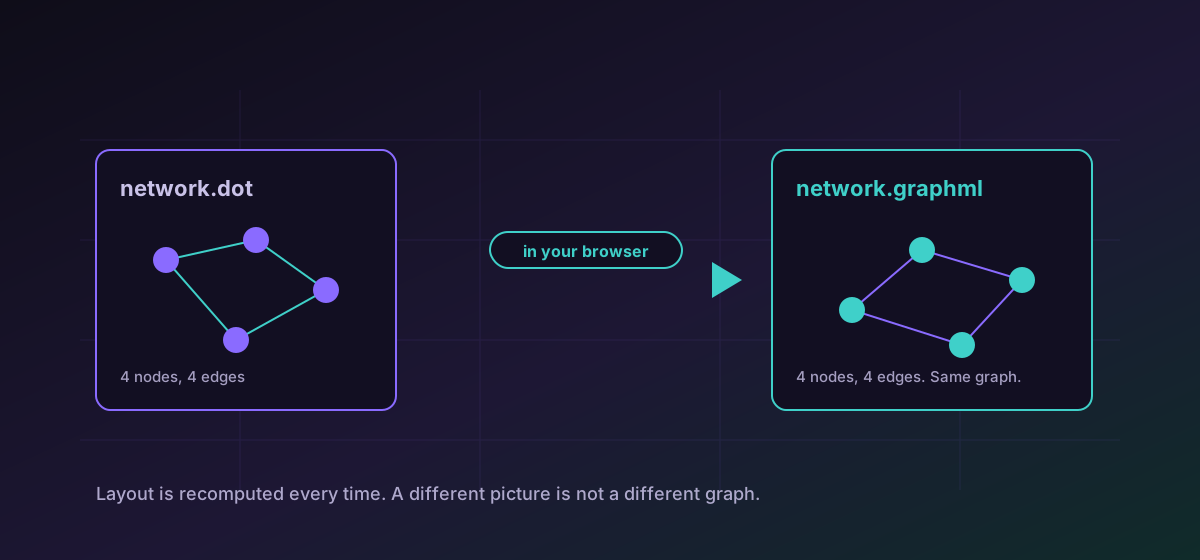
A graph is a set of things and the connections between them: a network diagram, a dependency tree, a social network, a state machine. The idea is simple and the file formats are not interchangeable, because each was designed by a different community for a different purpose.
What each format grew up doing#
- DOT is Graphviz's language. It is terse, readable, and designed to be written by hand or generated by a program that wants a picture. It describes structure and styling hints, and Graphviz decides the layout.
- GraphML is the XML standard for graph interchange, built to carry arbitrary attributes on nodes and edges. It is verbose and it is the one most analysis tools agree on.
- GEXF comes from the Gephi world and adds something unusual: time. It can describe a graph that changes, with nodes and edges appearing and disappearing over a period.
So the common moves are DOT to GraphML when a generated diagram needs analysing, GEXF to GraphML when moving between tools, and GraphML to JSON when the graph is going into code.
Structure travels. Appearance usually does not#
Some formats can store coordinates, and GEXF in particular often does. Whether the receiving tool uses them is another question entirely, and most will re-run their own layout unless told not to.
Directedness and attributes#
Two details matter more than they look. A graph is directed or undirected, and that is a property of the graph rather than of the drawing: an arrow from A to B is a different claim from a line between them. Converting between formats that express this differently can flip it, and the resulting analysis will be quietly wrong rather than visibly broken.
The other is attributes. GraphML declares typed attribute keys up front; DOT treats them as free-form strings. Going from GraphML to DOT can therefore lose type information, and going the other way may require guessing it.
Checking a converted graph#
- Count nodes and edges on both sides. This catches most real failures immediately.
- Confirm directedness matches, because nothing downstream will warn you if it does not.
- Check one node's attributes in full rather than sampling the file visually.
- Ignore the layout entirely unless you deliberately exported coordinates.
Once a graph is JSON, the ordinary data tools apply; see CSV, JSON and Excel conversions for moving it further, and verifying conversion results for the general habit.
Troubleshooting
Layout is computed at draw time from a seed, not stored. The structure is almost certainly identical; count nodes and edges to confirm.
Check directedness first. An undirected graph read as directed, or the reverse, changes almost every metric without producing an error.
DOT treats attributes as free-form text while GraphML declares types. Type information does not survive a trip through DOT.
Everything runs in your device's memory. Sample the graph or work in a desktop tool for networks in the millions of edges.
Frequently asked questions
Which graph format should I standardise on?
GraphML for interchange and analysis, because it carries typed attributes and most tools read it. DOT when the point is to draw a diagram with Graphviz. GEXF when the graph changes over time.
Why did my layout change?
Because layout is usually recomputed rather than stored, from a seed that differs between runs. The graph is the same; the picture is not. Export an image too if a specific arrangement matters.
Does directedness survive conversion?
It should, and it is the first thing to verify, because a flip produces wrong analysis rather than a visible error. An arrow from A to B is a different claim from a line between them.
Can I convert a graph to a spreadsheet?
Indirectly. Convert to JSON first, then reshape into an edge list. A graph is not naturally tabular, so what the table should contain is a decision rather than a conversion.
Is my network data uploaded?
No. It runs in your browser, which matters because social and organisational graphs describe real relationships and stay re-identifiable even after names are stripped.